The method · the money app that shows its work
We publish the method, the evidence, and the limits.
WealthAge brings your accounts, transactions, spending, cash flow, net worth and recurring charges into one place, then scores how prepared that picture is for a shock.
Every score asks to be taken on trust. This page publishes the method, the validation arithmetic, and the limits instead.
The WealthAge Resilience Score™ is a personal 0–1000 measure of how prepared your current financial picture is for a financial shock. It works like a credit score, one number you own and watch, but it answers your question, not a lender’s: if the income stopped, how long would you stand? Instead of averaging opinions, it simulates a shock against your real finances (what you could actually access, what keeps draining, what income would replace) across six determinants: liquid runway, income adequacy, committed costs, debt service, income replacement, and protective context. It was validated on the U.S. Census Bureau’s Survey of Income and Program Participation, where it predicted real hardship better than savings-runway alone. We publish the method and show your reason codes; we don’t publish the machinery. It’s informational and yours: not a credit score, consumer report, lending or eligibility input, investment recommendation, or guarantee.
By Steven Sterling, who built it: the score, the engine, and the validation study. Every score figure on this page, including the coverage and determinant readings (687, 5.2 months, 422, 814), is an illustrative fixture, never a real user.
Specimen · not a real user
- Your WealthAge score
- 687
- Runway behind it
- 5.2 months
- Holding it up
- Liquid runway
- Holding it down
- Income replacement
- Coverage when computed
- 95% of the picture
Every score ships with its reason codes, exactly like this.
The engine · seven steps
The money app runs the same seven-step shock for every household.
The commitment above starts here: the method is the engine, published step by step. It does not grade your habits and it does not average opinions. It runs the shock in the same order every time, and each step carries the limit that keeps it honest.
The engine as published 2026-07-29. Validated before publication on U.S. Census data, 2022 finances against 2023 outcomes. Restated on this page 2026-08-09.
Seven steps in, six determinants come out. Here is what each one watches.
What the score weighs
Six determinants go in, and you see each one’s direction.
Liquid runway, income adequacy, committed costs, debt service, income replacement (including AI-occupation exposure), and protective context. Runway weighs heaviest and protective context lightest, in words and in order, never as published percentages. Whenever your score is shown, your reason codes name which determinant is holding it up and which is pulling it down.
They read from the same numbers the money app assembles: connected or uploaded, every figure carrying its source and the time it was last confirmed.
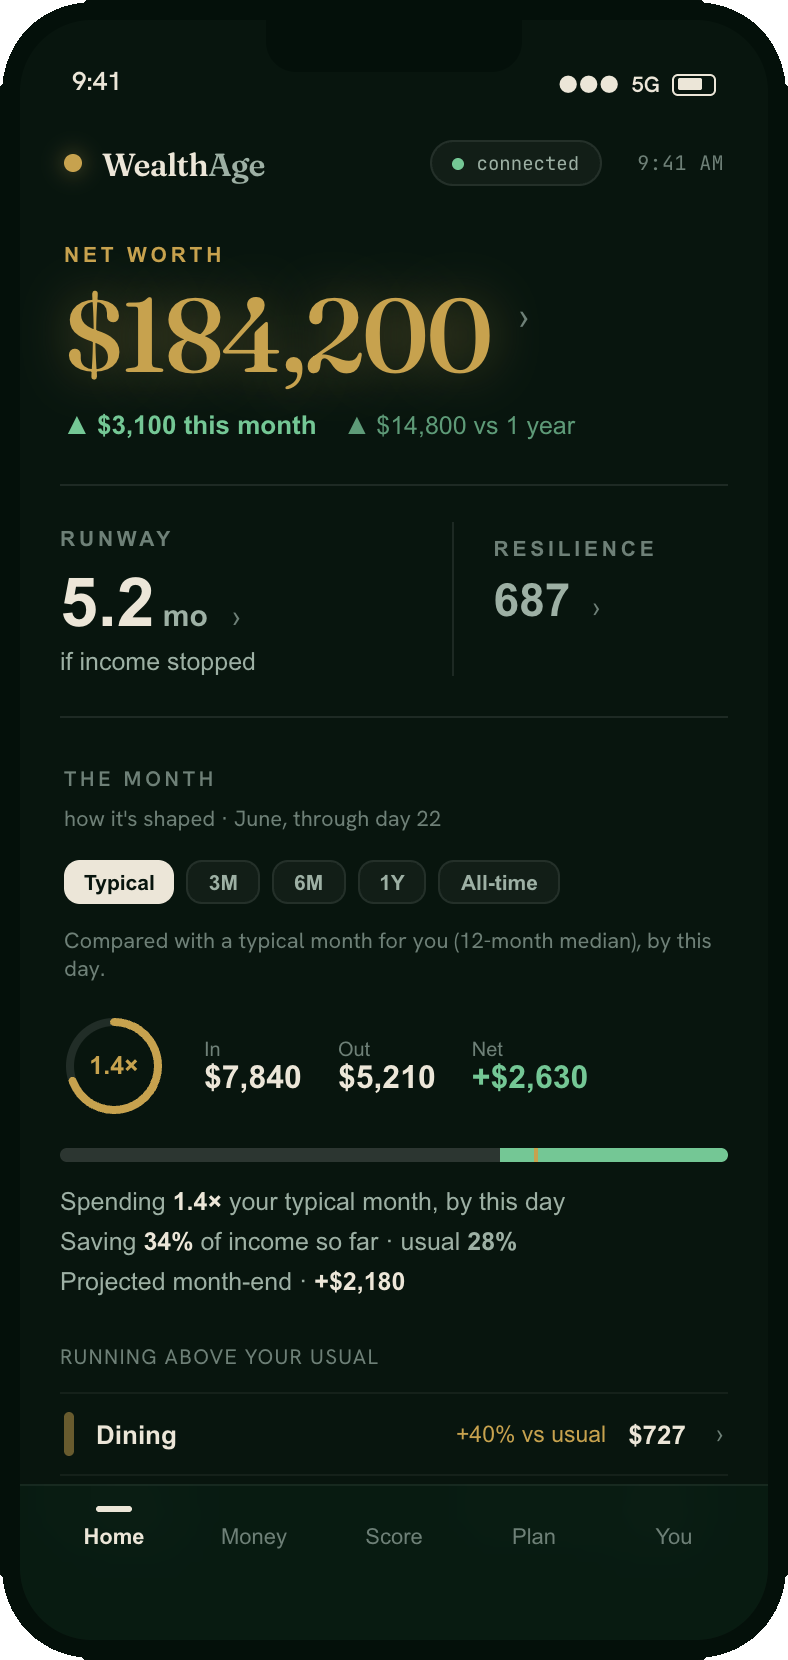
The assembled picture the determinants read from: net worth, runway, the resilience reading, and the month so far, in one place.
One household’s determinant reading: the same illustrative fixture as the 687 specimen above, sub-scores and never weights, never a real user.
Stated mechanics are cheap. The next section is the test.
The evidence
The model beat the months-of-expenses rule on 24,162 real households.
On 24,162 households, the months-of-expenses rule picked the more fragile household 64.0% of the time. The WealthAge model picked it 71.7%.

The reading as the app presents it: the coverage the score was computed from, and the sentence behind the number.
The model was validated on the U.S. Census Bureau’s Survey of Income and Program Participation: 24,162 real households, their 2022 finances against whether they actually hit hardship in 2023. Hardship means what the survey measures: a missed rent, mortgage or utility payment, or not enough food; 11.5% of the households hit it. The test: take two households, one that later hit the hardship outcome and one that did not, and see how often each method ranks them in the right order.
- Months-of-expenses rule of thumb
- 64.0%
- The WealthAge model
- 71.7%
- A coin flip, for scale
- 50.0%
In formal terms, AUC 0.640 for the rule of thumb and 0.717 for the model: a difference of +0.077, with a 95% confidence interval of +0.065 to +0.089. AUC measures how often the instrument ranks a household that later hit hardship as more fragile than one that did not: 0.5 is a coin flip, and 1.0 would be an oracle.
It beats the rule of thumb. It is honestly short of an oracle. That is why every score carries a confidence read, computed from how complete your data is.
Two limits, published with the result: the validation ran on survey-reported finances, not connected accounts. And its households are Census respondents, never WealthAge users.
Income is not resilience.
- $18k a month, over-committed earner
- 422
- Modest income, disciplined saver
- 814
Research about a population, never a ranking of you. The 422 and 814 above, like every score figure on this page, are illustrative fixtures, never real users.
Numbers need sources. Both of this page’s are named next.
The third parties
Both outside parties are named, and neither of them endorses us.
U.S. Census Bureau · Survey of Income and Program Participation the public survey the validation runs on: 24,162 households, 2022 finances against 2023 outcomes. Anyone can obtain the same survey from census.gov and reproduce the 64.0% baseline themselves. The Bureau publishes the survey; it does not endorse this product.
Plaid · account connections live connections are made through Plaid, and they are read-only. Uploaded files enter the same system and produce the same product, and every imported row keeps the file it came from and its place in it.
What we publish is above. What we keep closed is a decision too, and it is stated just as plainly.
The boundary
We publish what determines your score, and name what stays closed.
We publish the method: what goes in, why, and how well it predicts. We don’t publish the machinery: the exact weights, thresholds, and calibration. That is the same boundary every serious score keeps.
The machinery stays closed for a reason. A score whose formula is public can be tuned to instead of earned, and then it measures the tuning. The boundary is what keeps the number describing your position instead of rewarding whoever reverse-engineered the formula. It has a cost, and we state it: the 64.0% baseline is reproducible by anyone with the survey, and our own 71.7% is not, because the machinery that produces it stays closed.
What the published half holds
The inputs the six determinants, and why each one is there.
The mechanism the seven-step shock, run the same way for every household.
The evidence the validation arithmetic above, with its denominators and dates.
What the score is not
Not a credit score and not a consumer report or lending input.
Not a guarantee and never a verdict on your past.
Not a game no tiers, no grades, no badges.
Monarch Money’s security page, read live 2026-08-08, describes infrastructure, and fairly so: certificates, vetted partners, encryption. Infrastructure answers whether your data is safe. This page answers a different question: whether the number is honest.
The same discipline governs what the score refuses to say.
The standards
The score holds to what it can prove.
Every line below is a standard the score meets today, stated with the limit that enforces it. When one of those limits lifts, this page changes the same day the product does.
- The method is public before you pay. What goes in, why, and how well it predicts, on this page, in plain words. You can read all of it without an account.
- A confidence read ships with every score. It is computed from how complete your data is. A thin picture earns an honest, lower confidence, never a confident guess.
- Your score is about you alone. Your WealthAge score is never expressed as a percentile or a ranking of our users, because no comparison model has passed the validation bar the score itself had to pass. Where we do show where a household sits, it is computed from public survey data, labeled and dated, and it is never your score.
- The score reads today, and says so. Every score surface carries its as-of time. We do not forecast your score; a forecast ships the day it survives the same validation bar the score did.
- The world is reported separately. A dated Macro Climate read sits beside your number, never blended into it, so a shift in the world never arrives disguised as a shift in your finances.
- Coverage is stated, never assumed. The score sees the accounts you connect or upload, and it tells you what share of your picture it saw when it computed.
You can watch the method work before connecting anything at all.
Also free
You can see the shape of the answer first.
The free stress test asks six questions and returns an estimate of the how-long answer, computed from what you enter rather than from your full picture. No bank login, no card. A free account at the end saves your estimate. The savings runway tool answers a narrower question the same way, and both sit on the tools page.
Whichever you try first, the same questions tend to come up.
Questions
Every question a skeptical reader brings to a number, answered here.
How is the WealthAge Resilience Score calculated?
It simulates a shock against your real money: what you could actually access, what keeps draining, and what would replace your income. Six determinants combine into a 0 to 1000 reading. Liquid runway weighs heaviest, and severity gates cap severe fragility, so strengths can never average away insolvency.
Is the WealthAge Resilience Score a credit score?
No. It works the way a credit score does, one number you own and watch, but it answers your question, not a lender’s. It is informational and yours: not a credit score, consumer report, lending or eligibility input, investment recommendation, or guarantee.
How is the WealthAge Resilience Score validated?
On public data. The model was scored against the U.S. Census Bureau Survey of Income and Program Participation: 24,162 households, their 2022 finances against whether they actually hit hardship in 2023. Given two households, one of which later hit hardship, the months-of-expenses rule picked the more fragile one 64.0% of the time; the WealthAge model picked it 71.7% of the time, measured as AUC, 0.640 against 0.717, a difference of +0.077 with a 95% confidence interval of +0.065 to +0.089. Every score also carries a confidence read based on how complete your data is.
Why not publish the exact weights?
We publish the method: what goes in, why, and how well it predicts. We don’t publish the machinery: the exact weights, thresholds, and calibration. That is the same boundary every serious score keeps. A score whose formula is public can be tuned to instead of earned, and then it measures the tuning.
What can the score see, and what can it not?
It sees exactly what you connect or upload, and nothing else. An account you never bring in is not in your runway. That is why every score carries a confidence read based on how complete your data is, and an as-of time saying when it was computed.
Are the example numbers on this site real users?
No. Every example figure on this site, including the coverage and determinant readings (687, 5.2 months, 422, 814), is an illustrative fixture built to show how the instrument reads, never a real user, and each one is labeled that way where it appears.
Can my score move when my finances did not change?
Your score recomputes from your latest synced or uploaded data, and every score surface carries its as-of time. A separate, dated Macro Climate read on the world is shown beside your number, never blended into it. When that reading moves on macro alone, your finances did not change. The world did.
That is the method, end to end; broader questions live on the FAQ page. What remains is running it on your own numbers.
Read the method, then run it on your own numbers.
One limit, stated plainly. WealthAge can only see what you connect or upload. An account you never bring in is not in your runway, and the confidence read will say so rather than pretend completeness.
The method is readable before you pay.
WealthAge is not a financial advisor; the score describes, it does not prescribe.